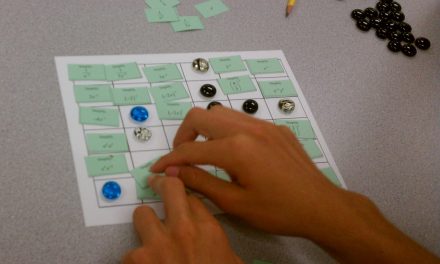
Okay, technically it was a workshop at ICTCM, but with 30 math faculty in one room, all armed with computers, I couldn’t help but make it a discovery and brainstorming session too. I’m a firm believer in harnessing the power of a room of people instead of talking to them (provided that we have some technology to facilitate that).
This post is Part I … the discovery portion of the workshop.
One of the things that made this workshop a bit out-of-the-ordinary for math workshops was that I set up a “backchannel” for participants to use to share their thoughts, discoveries, and ideas. To do this, I used a Chatzy Virtual Room – anyone can “join the room” as long as they know the URL – just state your name, and you’re in the chat room. This made the discovery process collaborative, as well as fast and furious as everyone in the room got a chance to contribute to the conversation in real time.

The first question I was asked (which I am asked in almost every workshop I do), is how on earth I was magnifying just a small portion of the screen (like where the input box was). I use a free tool called the Virtual Magnifier.

The group “play” with Wolfram Alpha lasted for about an hour, during which we (they, mostly) discovered quite a few interesting things, all of which I am sharing with you here in a clickable format.
- Find a line between two points
- Find a quadratic to fit three points
- Find a line with designated slope and point
- Could not find a line parallel or perpendicular to a given line through a point
- What about a line with infinite slope? [we couldn’t quite figure this one out]
- Graphing a vertical line with other functions (no problem), but graphing a vertical line by itself was a bit problematic.
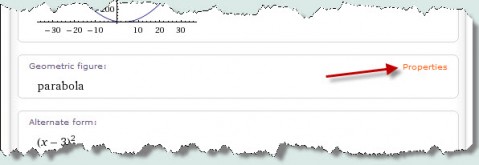
- Inputting an expression yields all sorts of information (graphs, factored form, roots, derivative, integral, etc.) If you follow this link, make sure to click on Properties next to the word “parabola.”
- Want to see more than one graph on the same coor
 dinate plane? [use a comma between the expressions or equations]
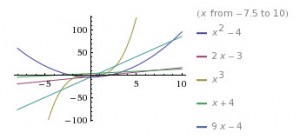
 - You can actually plot a LOT of curves at once, and each one gets a different color … take that graphing calculators.
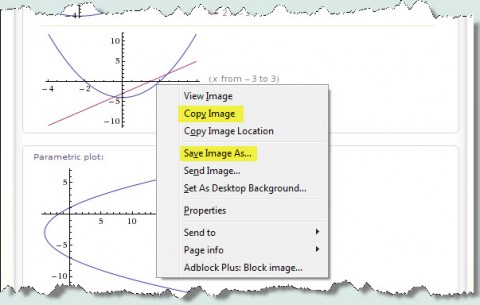
Did we forget to mention that you can copy images (or save them) directly from W|A output? [right click or command-click (mac) on the image to get copy and save options] You can actually do this for any output of W|A, including tables, equations, and images.
- Plot a conic by just typing the equation
- Find the intersections between two functions
- Find a circle with a given center and point
- Generate a formula for solving a particular type of cubic equation
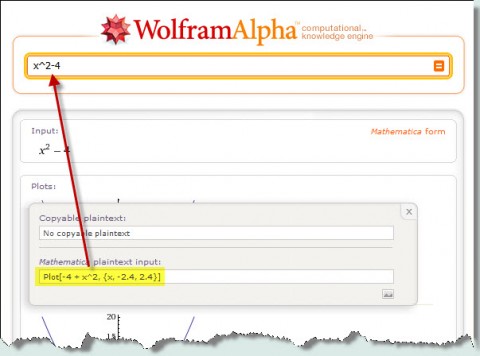
- You can also change the viewing window for your graphs. To do this just click on the graph, then copy the “Mathematica plaintext input” and paste it into the W|A input box. Change the window limits appropriately. You can also change the y-axis view.
- Find the orthocenter of a triangle
- Solve a trig equation in general, or on a specific interval [note: to do is less than or equal to, use <=]
- Solve an equation involving an integral
- Solve an equation for a specific variable like this [note: click on Show Steps too!]
- Generate a truth table
- Get a list of Pythagorean Triples
- See a graph of the Unit Circle
- See all the information about the PERP protein [note: that was an accidental discovery I think]
- Some of the searches led participants to discover the Wolfram Demonstrations Project (not a part of Wolfram Alpha, but a separate awesome project)

- Convert from Roman Numerals to decimal
- Find the sum of a series (including the results of various Series Tests)
- Find Egyptian Fractions
- Find the continuation of a number sequence
- Find the prime factorization of a number
- Perform modular arithmetic
- Find the inverse of a function [note: complete with graph showing reflection over the line y=x]

- When you use ln(x) the output shows log(x), which has traditionally been Mathematica notation for natural log. To get a log with base b, use log(b,x). Yes, the graphs suck. That’s something I’ll post about later this week.
With Wolfram Alpha, you can compare any list of items that have some kind of data associated with them. Just separate the items with a comma:
- Find how many times a particular DNA sequence occurs
- Use Wolfram Alpha as a dictionary or as a thesaurus
- Find the calorie information for a food, here’s your Starbuck’s Chai Tea Latte
- For something really scary, compare the Big Mac to the Whopper
- After that, you could calculate your risk of heart disease
- Calculate the calories you’ll burn in your workout
Participants also stumbled upon Alpha’s sense of humor …
- How much would could a woodchuck chuck?
- How many angels on the head of a pin?
- What is the meaning of life?
- How many licks does it take to get to the center of a Tootsie Pop?
That was approximately one hour of our Wolfram Alpha Workshop with about 95% of the content and discovery being done by participants. It took me three hours to write that up, which just goes to show you how powerful a backchannel chat window can be! I will save the brainstorming session “How can we restructure classroom learning and assignments to use Wolfram Alpha?” in another post.

 dinate plane? [use a comma between the expressions or equations]
