
For years, instructors all over the world have been coached to begin making more “data-driven decisions” and for years, we just haven’t gotten easy access to our data. I won’t even begin to rant about just how difficult it has been to get usable data out of Blackboard or Datatel. But on Thursday, that all changed.

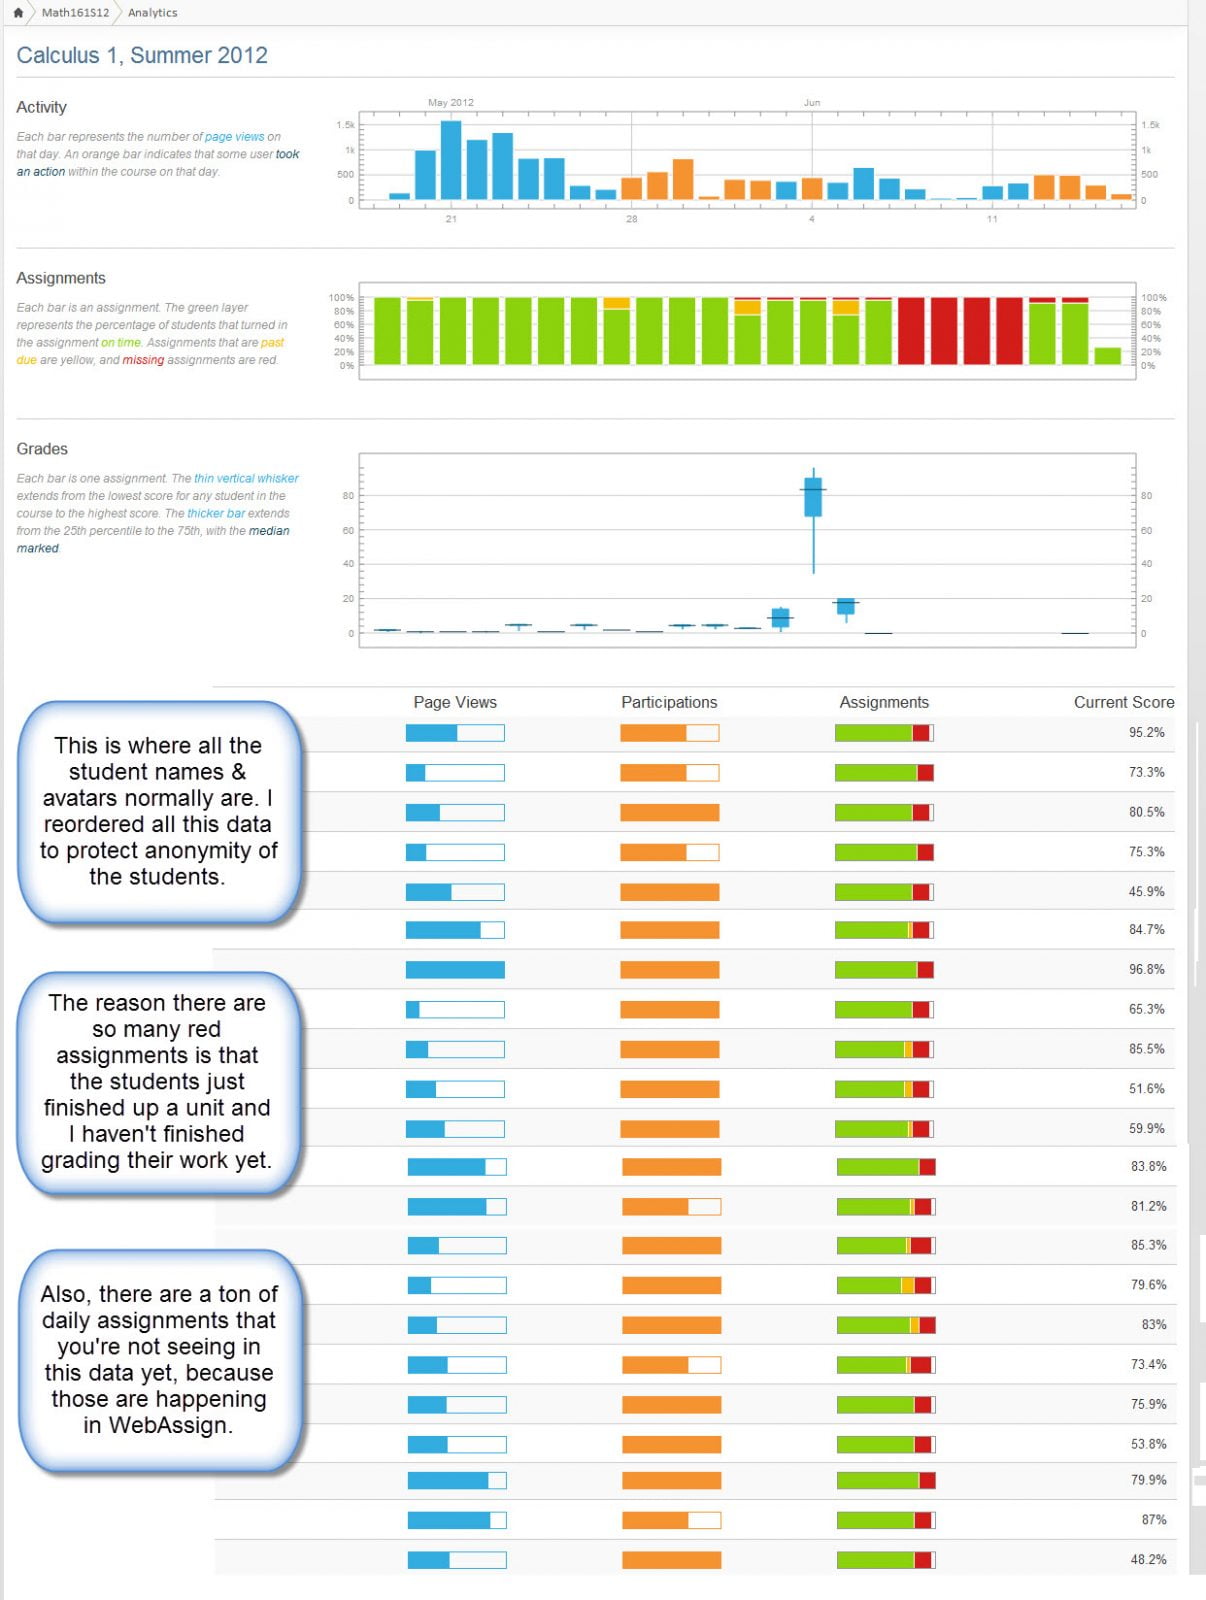
Order of data randomly changed to protect student identities. Click on image to enlarge.
On Thursday, Instructure turned ON Canvas Analytics. And now any instructor who’s been teaching out of Canvas can see ALL the data about their students and courses – not just from this point forwards, but from this point forwards AND backwards. That is a HUGE leap forward in education. In one hour, I have now seen more data about my students, their behaviors, and their interactions with the course I teach than I have from using Blackboard for 6 years.

This data is only going to get better and better as Instructure actually does listen to their clients and is constantly pushing for better and better features to help us do what we do best: help students to learn and be successful.
Here are the full images of screenshots of analytics from my Calculus course. I’ll keep adding snapshots as the semester progresses. Enjoy! Oh, and you might want to pull out your hanky first, because there are going to be tears of joy (if you use or are about to use Canvas) or tears of frustration (if you don’t).
Analytics is all about student success. With data at our fingertips, we can be the best possible learning coaches. We can perform better research about the Scholarship of Teaching and Learning. We can make better assessment decisions. We can make better pedagogical choices. Welcome to the new era of learning.

