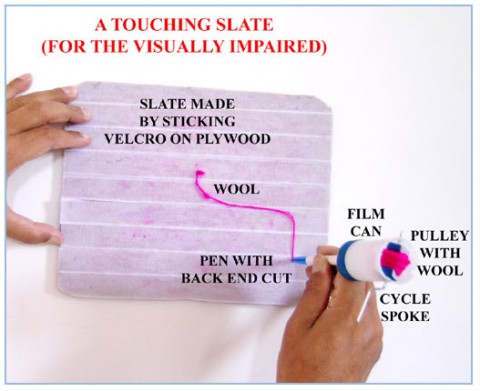
If I had to produce tactile graphs for the visually-impaired, or have such a student produce a graph for me, I think I would spend an hour to create one of these velcro and wool yarn slates for the blind.

I stumbled across this Touching Slate “toy” in MAKE Magazine’s current issue and realized that this simple slate solves a key problem in teaching higher-level mathematics to visually-impaired students: How can a teacher or student quickly produce graphs of functions to share during a class, study session, or exam? I think you could use yarn of different thicknesses in order to put multiple functions on the same graph. With several of these easy to produce slates, you could have several pre-made graphs for exams, lectures, on-the-fly questions, etc.
Here’s a one-minute video with instructions for making the slate.
For other resources to create graphs for the visually-impaired, you should also check out Tactile Maps and Graphics, and for those of you who need to teach Calc III, you should check out Andy Long’s function machine or make friends with someone who has a 3D printer (the Industrial Technology department on our campus has one now).


